Given the interest in our January 2024 e-news article on vineyard sales, we are pleased to follow up with a detailed analysis of vineyard sales by vineyard size.
According to the Vinehealth Australia Register, there are more than 4,500 vineyards in South Australia of 0.5 hectares or more in size. From 2018 to 2023, we recorded between 160 to 250 vineyard sales annually. This equates to a turnover of between 3.7% to 5.5%.
Below we present observations of these vineyard sales during the period 2020 to 2023, looking at the breakdown of area of vineyards sold and number of vineyards sold according to the size category of the vineyard. Categories used were those reported in the annual SA Winegrape Crush Survey, being <10 hectares (ha), 10 to <25 ha, 25 to <50 ha, 50 to <100ha and 100+ ha. In addition, we have chosen to further split the 0 to <10 hectare category due to the volume of vineyard sales for small vineyards.
Key findings include:
- Between 2020 and 2023, there were comparatively high sales volumes attributed to vineyards in the size category of 0.5 to 3 ha.
- Sales from the vineyard size category of <10 to 25 ha steadily increased from 2020 to 2023.
- There were proportionately few sales from vineyards in the size category of >25 to 50 ha between 2020 and 2023.
- In 2022, total SA vineyard area sold was dominated by the sale of vineyards in the 100+ ha category.
- There were relatively low sales in 2020 and 2023 from vineyards in the size categories of >25 to 50 ha and >50 to 100 ha.
Analysis of the area of vineyards sold between 2020 to 2023
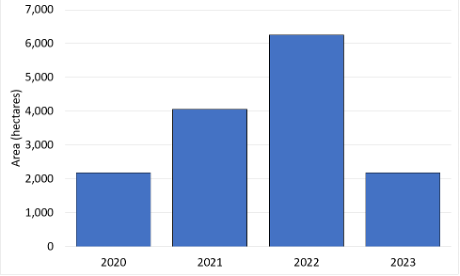
Total South Australian vineyard area sold between 2020 and 2023 showed marked differences year-on-year (Figure 1). Vineyard area sold in 2022 was approximately three times that sold in either 2020 or 2023, and 50% higher than in 2021.
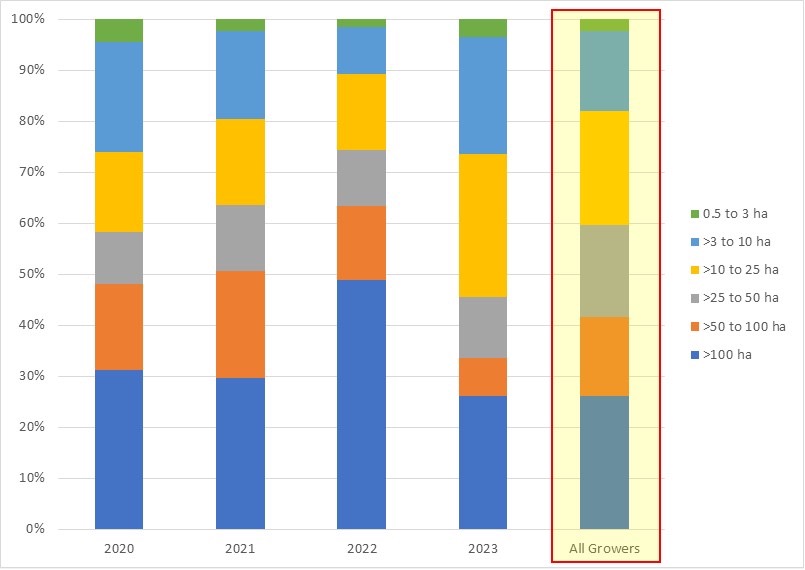
This trend in total vineyard area sold can be further investigated by analysing how closely the relative size of the vineyards sold between 2020 and 2023 matched the current January 2024 split of vineyard area by vineyard size category on the Register (denoted by the bar ‘All Growers’ in Figure 2).
We find that:
- South Australia’s vineyard area is currently dominated by vineyards in two size categories: those >10 to 25ha, and those 100+ha. Together these categories comprise approximately 50% of the total vineyard area. Vineyards in the size category of >50 to 100ha contribute the lowest proportion of area (approximately 15%) to the state’s total vineyard area, and 40% of the state’s vineyard area is comprised of vineyards <25 ha in size.
- Vineyard sales over the period 2020 to 2023 indicate over-representation by area from vineyards in the largest (100+ ha) and smallest vineyard size categories (≤10 ha). This is perhaps indicative of the greatest ability to be agile under current industry conditions. It was not until 2023 when sales from vineyards in the >10-25 ha category became a significant proportion of the overall vineyard sales in a year. For each of the four years, the proportion of vineyard area sold from vineyards in the >25 – 50ha category was very similar, however, under-represented as a proportion of total planted area.
- Sales of vineyards in 2020 when split by vineyard size category, showed general similarity with the current January 2024 total vineyard area split proportionately by vineyard size. However, the largest and smallest vineyard size categories (0.5-3ha, >3-10ha, >50-100 ha, 100ha+) were slightly over-represented in the total vineyard area sold that year.
- Sales of vineyards in 2021 when split by vineyard size category, also showed general similarity with the current January 2024 total vineyard area split proportionately by vineyard size. The largest vineyard size categories of >50-100 ha and 100ha+ were over-represented in the total vineyard area sold that year.
- Sales of vineyards in 2022 when split by vineyard size category, showed considerable departure from the current January 2024 total vineyard area split proportionately by vineyard size due to the sales of large vineyards. The largest vineyard size category of 100ha+, usually representing approximately 25% of total area sold, this year represented close to 50%.
- Sales of vineyards in 2023 when split by vineyard size category, showed some departure from the current January 2024 total vineyard area split proportionately by vineyard size due to more smaller vineyards being sold. The smallest vineyard size categories of 0.5-3ha, >3-10ha and >10-25ha of 100ha+, were over-represented in the total vineyard area sold that year. The vineyard size categories of >25-50ha and >50-100ha were well under-represented.
Analysis of the number of vineyards sold between 2020 to 2023
The number of South Australian vineyards sold between 2020 and 2023 also showed differences year-on-year, with more vineyards sold in 2021 and 2022 than in 2020 and 2023 (Figure 3).
We can further interrogate this trend in number of vineyards sold, by looking at whether the number of sales is driven by vineyards in any particular size category, in the same way analysis was performed above for vineyard area.
We find that:
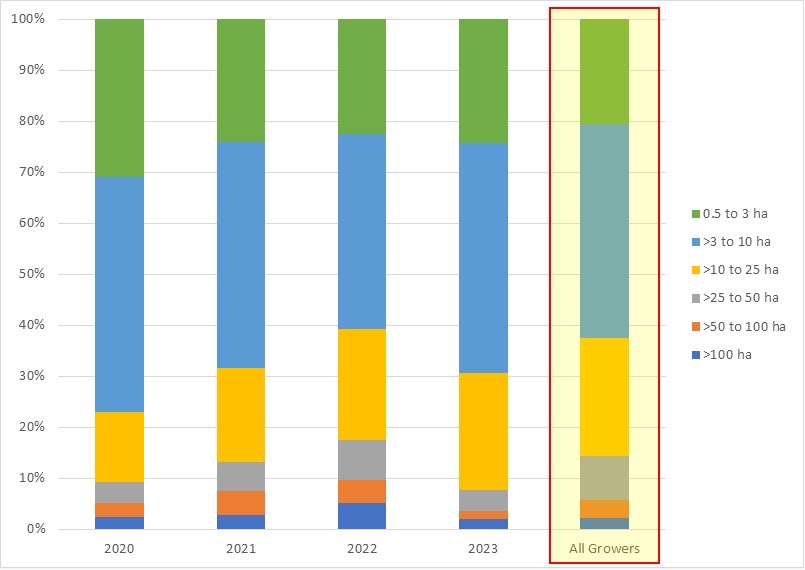
- Vineyards in the size categories of 0.5-3 ha and >3-10 ha currently dominate the number of vineyards in the state, being just over 60%. Including vineyards in the >10 to 25 ha category, we note that 85% of SA’s vineyards are 25 ha or less in size (Figure 4).
- Vineyard sales over the period 2020 to 2023 indicate that between 60-80% of sales were of vineyards 10 ha or smaller in size. This indicates proportionately high turnover of SA’s smallest vineyards. At the other end of the scale, the number of vineyards sold in the largest size category of 100+ ha has been steady and in line with the number of vineyards these represent of the state’s total. However, in 2022, where there was a significantly higher sales volume of vineyards from this largest size category.
- Vineyards of less than 3ha in size comprise approximately 20% of the state’s vineyards by number, and collectively comprise around 2.5% of total SA vineyard area. The number of vineyard sales from this size category was proportionately overrepresented for each of the past four years, and particularly in 2020.
- The >3-10ha vineyard size category comprises around 40% of the number of vineyards on the Register. Vineyard sales from this size category show a slight overrepresentation in 2020 and a slight underrepresentation in 2022, mirroring the results by area.
- Just over 20% of the vineyards on the Register are those in the size category of >10 to 25ha. The number of sales of vineyards in this size category increased over time from 14% of the number of sales in 2020, up to 23% of sales in 2023, but was underrepresented as a size category in 2020 and in 2021.
- Around 10% of the vineyards on the Register are those in the size category of >25 to 50ha. The number of sales of vineyards in this size category was consistently underrepresented in each of the years observed from 2020 to 2023. Sales from this category were particularly low in both 2020 and 2023.
- Around 4% of the vineyards on the Register are those in the size category of >50 to 100ha. The proportion of vineyard sales from this size category was one of the most inconsistent over the four year period, being underrepresented in 2020 and 2023 and overrepresented in 2021 and 2022.
- Around 2% of the vineyards on the Register are those in the size category of >100ha. The proportion of vineyard sales from this size category was very consistent in 2020, 2021 and 2023. However, there were approximately double the number of sales of large vineyards in 2022 compared to the other years, as noted above in the contribution these sales made to the overall vineyard area sold in 2022.
Important notes about the data presented:
- Current as at 16 January 2024.
- Is that of whole vineyards and associated area sold as at the date of transfer reported to Vinehealth.
- Is exclusive of those vineyards that have been removed from the Vinehealth Register. Statistics on these whole vineyards that have been removed from the ground between 2020 and 2023, were shared in our December 2023 e-news.
- Includes both sales to an unrelated party and sales within a family; irrespective of whether there is a financial transaction.
- Is not indicative of the total land area associated with a sale, rather, the vineyard size categories presented relate to only area under vine.
Communicating property sales with Vinehealth
As part of the conveyancing process, Vinehealth Australia is informed of vineyard sales. However, we encourage growers undertaking sales to check in with us, especially for sales occurring within families, as these sales do not always follow the same process.
Together we can then ensure that ownership details in the Register are current at all times. Please contact Vinehealth’s Systems Manager Jo Bainbridge for all vineyard sales enquiries on (08) 8273 0550 between 8:30am and 4:30pm Monday to Thursday.