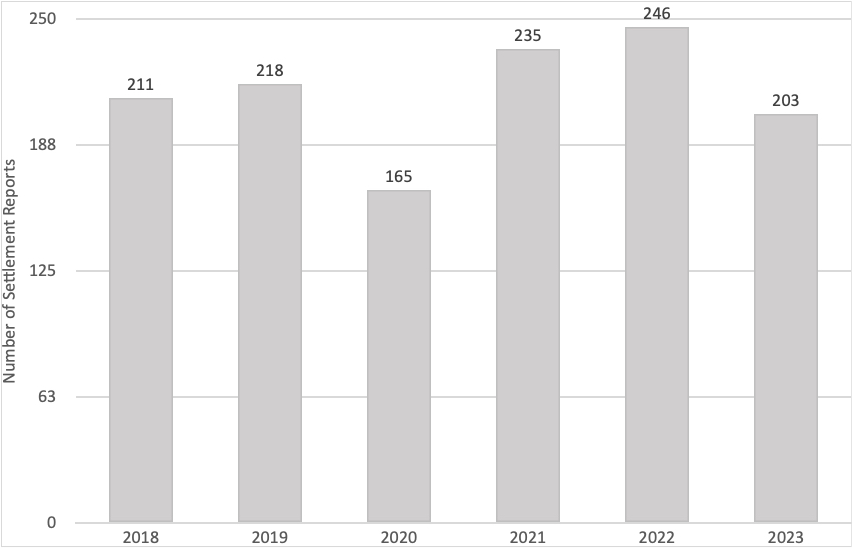
A review of the last six years of South Australian vineyard sales (2018 to 2023) through the formal conveyancing process shows consistency in number of whole vineyard settlements year-on-year, being between 200 to 250 per year.
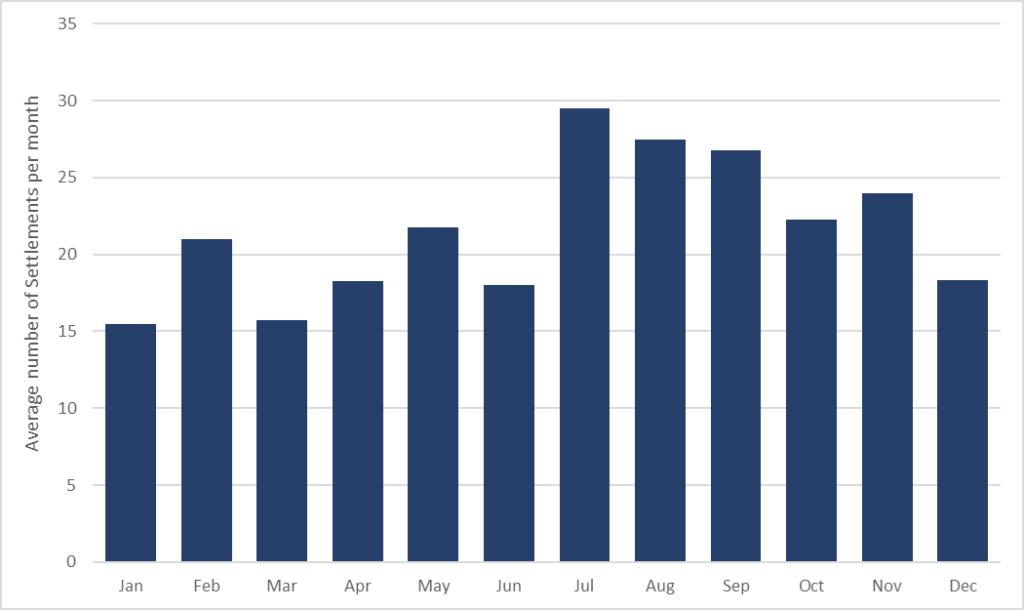
And over the last four years (2020 to 2023), it is evident that vineyard settlements most commonly occur between the months of July to November.
These values exclude changes of ownership between family members which do not initiate property interest reports.
Vinehealth Australia is required to be notified of any South Australian property interest involving a vineyard of 0.5 hectares or greater, to maintain the currency of the Register. As Vinehealth Australia is intrinsically linked to the vineyard sale process, we have the opportunity to review high level trends in whole vineyard sales over time.
The most notable decrease in vineyard settlements occurred in 2020 when there were only 165 settlement reports issued (Figure 1). This decrease could have been due to global uncertainty surrounding COVID and limitations on prospective buyers being able to undertake onsite property inspections.
The year with the second fewest vineyard settlements was 2023. Again, this year was marked by more local industry uncertainty, in both sales of grapes and wine.
The most consistent reduction in monthly vineyard sales appears to occur over the vintage period (Figure 2). This may be due to the busyness of the vintage period; a vendor wanting to sell a vineyard at the end of the season after grapes have been harvested and an income earned; or perhaps wanting to present a vineyard in arguably its best light in spring.
June is a relatively low sales month and July is the month of highest vineyard sales, which may also be indicative of financial year/tax implications.
Almost 40 percent of South Australia’s vineyard sales across the four year period between 2020 and 2023 have been in the Lower Murray Zone (Table 1). This is marginally higher than the number of vineyards in the Lower Murray as a proportion of the total number of vineyards in the state (34.4%), and accordingly, indicates a relatively high sales level by number of vineyards in this zone (109%).
However, the highest level of sales compared to number of vineyards in each zone over this four year period was noted in the Limestone Coast at 122% (Table 1). This result indicates particularly active business decisions to divest in this zone. On the other hand, there was relatively low vineyard turnover in the Barossa Zone over this four year period (Table 1).
| Zone | Percentage of State vineyard sales by Zone | Proportion of total vineyard number by Zone | Ratio of Sales to State Representation |
| Lower Murray | 37.6% | 34.4% | 109% |
| Fleurieu | 19.3% | 19.4% | 100% |
| Mount Lofty Ranges | 17.5% | 16.0% | 109% |
| Barossa | 15.1% | 21.4% | 70% |
| Limestone Coast | 10.2% | 8.4% | 122% |
| Far North | 0.2% | 0.3% | 82% |
| The Peninsulas | 0.1% | 0.1% | 100% |
| Total | 100% | 100% | 100% |